We’ll start with my session on Developer Tools in Chrome.
The first website I used was https://sweetshop.netlify.com/index.html
We started by seeing how to open the developer tools

Once in there, we looked at the device mode

We also inspected elements on the page by right clicking to get the below menu

We used the elements tab to look at how we could change the colour, text, and size of that element
Next, we looked at the console tab and what kinds of errors it can give you. A useful related post is https://www.restapitutorial.com/httpstatuscodes.html
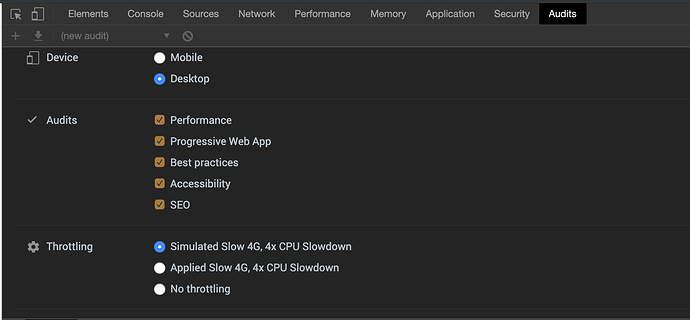
We jumped across the tabs a bit for the next step. It’s one I’ve found useful to help me to identify potentially risky areas in a product, the audits tab. It gives you a really detailed report that you can click through which will give you more information on potential risks and possible solutions.
As I mentioned in the session, I took the train between Lisburn and Lurgan on my commute which is notorious for poor phone signal. A great way to replicate this in the fibre broadband office environment is to use the Throttling option on the Network tab. Simply select the network connection type you’d like to mimmic and refresh the webpage

For the final example, we moved to Google Gruyere https://google-gruyere.appspot.com/ and explored the information that was stored in the Cookies on the Application tab
Finally, we looked at Bug Magnet and Check My Links
See the session from Manchester to see some more useful tips SWTC Manchester - Technical Testing and of course, the Chrome DevTools page https://developers.google.com/web/tools/chrome-devtools/
A list of sites you could practice on
 The hosts will be sharing here more information about their sessions and where you might learn more.


